Friday, April 16, 2010

Pie Chart using Java Script


In this tutorial we will show the simplest way to draw pie chart using java script..This is important to show some statistics of your system.

The Java script library used here is from http://www.walterzorn.com/jsgraphics/jsgraphics_e.htm

Let's imagine we need to export a registered users profile/statistics of a medical system and we need to know the number of registered users according to there roles and in a specific period.

Here is the steps:


1.Create Statistics Bean contains the attributes we need to view.
Example:
Select count(*) from users;
Select count(*) from users where role='Doctor';
Select count(*) from users where role='Patient';
Select count(*) from users where register_date between start_date and end_date;
Select count(*) from users where role='Doctor' and register_date between start_date and end_date;
Select count(*) from users where role='Patient' and register_date between start_date and end_date;

We will store the result values into bean variables.

2.Utility method for calculations:
In a helper class, add this utility method so it remove a lot of checks in the jsp file itself.

public static float devide(int value,int value2){
try{
if(value==0 || value2==0){
return 0;
}
float result=Math.round((float)value/value2*100);
return result;
}catch(Throwable t){
}
return 0;
}

This method will round the value and will check for 0 values.


3.In your JSP page ..
You need to have a specific dev to draw the pie chart on it.

<div id='pie' style="position:relative;">

The relative value is important as it allow drawing from x,y of this dev.


4.Import Java Script draw library:

<script language="JavaScript" src="/.../js/wz_jsgraphics.js"></script>


5.Add the JS draw method , it will looks like:
<script language="JavaScript">
function drawUsers(){
jg = new jsGraphics("s1");
jg.setPrintable(true);
jg.setColor("#999999");
jg.fillOval(500,285,60,50);
jg.fillOval(200,285,60,50);
jg.setColor("#0000ff"); // or use blue word
jg.fillEllipse(500,280,60,50,270.0,220.0);jg.drawString("Total Users="+<%=data.getUsers()%>,570,280);
jg.fillEllipse(200,280,60,50,270.0,220.0);jg.drawString("Period Added Users="+<%=data.getUsersInPeriod()%>,270,280);
jg.setColor("#ff0000"); // or use red word

value=<%=HelperUtils.devide(data.getDoctors(),data.getUsers())%>;
value2=<%=HelperUtils.devide(data.getPatients(),data.getUsers())%>;
value3=<%=HelperUtils.devide(data.getHealthUnits(),data.getUsers())%>;
if(value!=0) jg.fillArc(500, 280, 60,50,0,360*value/100);
jg.drawString("Total Dcotors="+value+"%",570,300);
jg.setColor("#00ff00"); // green
if(value2!=0) jg.fillArc(500, 280, 60,50,360*value/100,360*value/100+360*value2/100);
jg.drawString("Total Patients="+value2+"%",570,320);
jg.setColor("#ff00ff"); // magenta
if(value3!=0) jg.fillArc(500, 280, 60,50,,360*value/100+360*value2/100,360*value/100+360*value2/100+360*value3/100);
jg.drawString("Total HealthUnits="+value3+"%",570,340);
//new users graph
jg.setColor("#ff0000"); // red
value=<%=HelperUtils.devide(data.getDoctorsInPeriod(),data.getUsersInPeriod())%>;
value2=<%=HelperUtils.devide(data.getPatientsInPeriod(),data.getUsersInPeriod())%>;
value3=<%=HelperUtils.devide(data.getHealthUnitsInPeriod(),data.getUsersInPeriod())%>;
if(value!=0) jg.fillArc(200, 280, 60,50,0,360*value/100);
jg.drawString("Period Added Dcotors="+value+"%",270,300);
jg.setColor("#00ff00"); // green
if(value2!=0) jg.fillArc(200, 280, 60,50,360*value/100,360*value/100+360*value2/100);
jg.drawString("Period Added Patients="+value2+"%",270,320);
jg.setColor("#ff00ff"); // magenta
if(value3!=0) jg.fillArc(200, 280, 60,50,,360*value/100+360*value2/100,360*value/100+360*value2/100+360*value3/100);
jg.drawString("Period Added HealthUnits="+value3+"%",270,340);
jg.paint();
return;
}
</script>

6.In the body add:
<body onload="drawUsers();">

Simple and straightforward steps, the output will looks exactly like the post image.

You can enhance it more by drawing a small box as a chart key , beside each label and keep the label color as black, here is an example:


This done by drawing a box 6x6 beside each label :

jg.fillRect(570,5,6,6);

Other enhancements can be considered like increase the pie chart size and write over each section...etc.

Friday, April 9, 2010

Free Instant Messenger Server/Client 1.0


Today i have posted my 1st free project at SourceForge.net

Free Instant Messenger Server/Client 1.0

The project posted at the URL:

https://sourceforge.net/projects/fim1/

This project contain 3 parts:

1.Chat Server
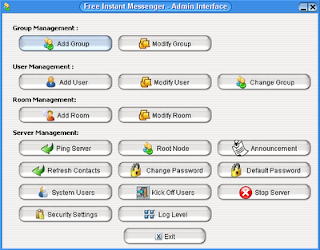
2.Chat Admin Client
3.Chat Client (image above)

They are build over Java Remote Method Invocation (RMI) technology, there are a lot of features in this server , including 3 different security level , file transfer , announcements , nice emoticons and easy customizable project.

The installation of this chat server toke less than 2 minutes !

Here is a copy of the installation guide installed on the SourceForge:


Free Instant Messenger V1.0

Installation Guide of FIM Server
================================
FIM Version 1.0
---------------
Developed by

Osama Mohammad Oransa
© 2009

How to Run FIM Server:
======================
1.Open the admin config foler:

a) Open server.properties:
Change the following:
rootNode=MyCompany
--> change it to express your company or organization name.
--> You may change the working port as well

b) Open data2.xml
Edit the admin user email account, into the needed email of your company admin:


1000
Admin User
admin@my.org

2.Run Start Server .exe file or batch file (windows .bat) or .jar file by : java -jar command in UNIX (same as in the batch file).

3.Go to the admin config folder:
Edit the following configurations:

serverURL=localhost
serverPort=1190
adminEmail=admin@my.org

--> Admin email account and the server IP and port.

4.Run Admin Interface
--> Default password is adminadmin
Once you logged in change the adminadmin interface to any password.

5.Default password for any created user is user, you can change it easily by admin interface, set default password.

6.Before distrubute the client interface, go to the config folder and edit the following:
userEmail=@my.org
serverURL=localhost
serverPort=1190

-->Update email domain to your organization/company domain.
-->Update server IP and Port.

7.You can run now the client , default password is "user" , unless you changed it by default password option in the admin interface, ask the system users to change the passwords once log into the system.


This is how the admin interface looks like.


Enjoy it..... or participate in developing it and integrate it with the standard protocol like XMPP.

You can also customize it , enhance it and release a new variant of it.


Wednesday, April 7, 2010

Nice Mathematical Operations

In this post we will share some nice mathematical operations, these operations exist in all languages we will show the logic behind them or work-around to get the same result for any reason.
The common thing when you work on mobile headset and it is still old and not supporting float calculations, how to avoid max loss of precision especially in case of sequential operations.

(1) Square Root:
//Newton’s method for finding the root of a function
private static double square_root(double a){
double x=0 , xold=0 ;
x = a;
do{
xold = x ;
x=(xold+(a/xold))/2.0;
System.out.println(x) ;
} while(x!=xold);
return x;
}

(2) Simple Round Function:
This is the logic behind the round function, add 0.5 to the fraction number and take the int value.
//simple round function using float to int.
private static int round(float s){
int x=new Double(s+0.5).intValue();
System.out.println("Round results="+x) ;
return x;
}

(3) Get Maximum Precision when no Float operations supported:
This is done simple by multiplying 1 number into predefined number according to the needed precision, then do the multiplication/division operation then divide the results again by this value to get the max possible precision.

private static int noFloatCalculation(int x,int y){
System.out.println("No Float results b4="+x/y) ;
int percision=100;
int s=(x*percision)/(y);
s=s/percision;
System.out.println("No Float results="+s) ;
return s;
}

(4) Get the Greatest Common Divisor for 2 numbers:(Euclid’s)
//Euclid’s Greatest Common Divisor (GCD)
private static int calculateGCD(int a, int b){
while(a!=b){
if(a>b) a=a-b;
else b=b-a;
}
System.out.println( "GCD="+a ) ; // or b since a=b
return a;
}

(5) Cumulative sum from 0 to x:
//cumulative sum from 0 to the send number
private static int caluclateSumFromZero(int end){
int i,start=0;
int cumulLoop=0;
for ( i=start; i<end ; i++) {
cumulLoop+=i ;
}
int cumul=(end*(end-1))/2;
System.out.println( cumulLoop+" closed -form:"+cumul);
return cumul;
}


(6) Calculating Factorial of a number:
//using recursive call
public static int factorial(int n){
if(n==0) return 1;
else return n*factorial(n-1);
}

(7) Selection Sort Algorithm:
To sort array of int , loop over them and swap the smaller one till you sort the array completely.

//loop sequential replace current with the the smallest one (if current is not the smallest)
//using 2 nested loops
static void SelectionSort(int[] array) {
int n=array.length;
for ( int i =0; i<n-1; i++){
for ( int j=i+1; j<n ; j++){
if(array[i]>array[j]){
//swap them
int temp=array[i];
array[i]=array[j];
array[j]=temp;
}
}
}
}
}

For String objects you do the same but you need to use the java built in compareTo() method to compare the 2 Strings, that return
the value 0 if the argument string is equal to this string; a value less than 0 if this string is lexicographically less than the string argument; and a value greater than 0 if this string is lexicographically greater than the string argument

//for String objects ...
static void SelectionSort(String[] array) {
int n=array.length;
for ( int i =0; i<n-1; i++){
for ( int j=i+1; j<n ; j++){
if(array[i].compareTo(array[j])>0){
//swap them
String temp=array[i];
array[i]=array[j];
array[j]=temp;
}
}
}
}

(8) Convert Decimal format into integer format:
To convert number formatted like 12.45 into 1245/100 , We simple multiply the number with the number of digits after the decimal point then we can get the integer division format...

Now what if we have round number like 15.23232323...... and 23 is repeated forever ?
We do the following simple steps:
x = 15.23232323..... (23 is repeated forever)
100x=1523.23232323...... (get 1 of the repeated sequence to the left of decimal point)
now subtract x from 100x --> 99x = 1508.0 so x=1508/99

Another example:
If we have x=15.8567567567567..... (567 is repeated forever)
1st 10x=158.567567567..... (get rid of the un-repeated part)
10000x=158567.567567.....
(get 1 of the repeated sequence to the left of decimal point)
now subtract 10x from 10000x --> 9990x=158409.0 , so x = 158409/9990.

Easy , right ?


Saturday, April 3, 2010

DICOM To Image

In this post we will go through using some free utilities to convert the DICOM file format; DICOM refer to Digital Imaging and Communications in Medicine.

For more information about DICOM visit the wiki page:

http://en.wikipedia.org/wiki/Digital_Imaging_and_Communications_in_Medicine

The Free utility "DICOM2" , can be downloaded from the URL:

http://www.barre.nom.fr/medical/dicom2/

It is free command line program, that can covert DICOM into any image format.

To try this example we need to download DICOM samples , an example for these sample files at the URL:
http://webscripts.softpedia.com/scriptDownload/DICOM-Example-Files-Download-34432.html

Put dicomm2.exe in the same folder of the images and run the following command:

dicom2.exe -param file

Examples :
1.To covert it into BMP:

>dicom2.exe -w brain_001.dcm
This will produce .BMP of this image

>dicom2.exe -t brain_001.dcm
This will produce .TXT of this image (i.e. meta-data of the DICOM file)

Example of the output image (brain_001.BMP):